

The Savings Glut, Trade Wars, and a Broader Definition of Global Liquidity, Part 2
Savings are a minor part of GROSS CAPITAL FLOWS

Part 1 can be found here. This is the post where I tell you that some really smart investors believe that global savings is but a small drop in the pool of the true footloose capital flowing between nations that drive exchange rates, interest rates, and asset prices (e.g. stocks, real estate, and even Bitcoin).
In the mid-1980s, the research department at Salomon Brothers investment bank (later acquired by Citigroup) pioneered an innovative approach to “global liquidity.” Led by Henry Kaufman and Marty Leibowitz, the people in the Salmon Brothers’ research department went on to populate other financial institutions in a kind of diaspora.

Their perspective was pretty contrarian to most macroeconomics. For them, the financial economy is what drives the “real” economy. I think it matters a lot to how we think about the “global savings glut” and the ongoing trade war between the U.S. and China.
It’s not exactly clear cut, but here is how I interpret a four-fold premise of the department:
A much broader definition of global liquidity — one that adds up ALL creditor’s balance sheets (central banks AND private sector money creation) — can be used to understand how exchange rates, interest rates, and asset prices move.
Gross flows of capital between nations matter more than net flows.
The type and quality of credit matters just as much as its quantity
And geopolitics matters too.
Keeping track of global liquidity with these four guiding principles was like having insider information on markets. It allowed Kaufman to predict (in 1986) the looming increasing frequency of financial crises. There were some other thinkers/investors onto this stuff (Goldsmith’s 1985 “Comparative National Balance Sheets” or Drunkermiller’s 1988 Barron’s interview, ), but it was Michael Howell author of the fantastic 2020 Capital Wars), who took the broadest definition of global liquidity possible and started tracking it and publishing it with a firm called “CrossBorder Capital.”
In what follows, I’m going to draw on Howell’s “Capital Wars” to do two things. First, what does CrossBorder Capital actually include in their huge measure of global liquidity? Second, I will elaborate some important implications that Howell drew from these about the way macroeconomics works in practice. It is rather contrarian in my judgment.
In a subsequent post (part 3), I’m going to lay out what this implies about economic history in the past three decades and how it relates to the “global savings glut to trade war” story in part 1.
(Any mistake are my own in this).
For the Salomon Diaspora, global savings is just a small part of the true global liquidity that moves the global economy. They track global savings, foreign direct investment, retail bank credit creation, central bank money creation, and the capital generated by non-bank financial institutions that flow through the world’s wholesale money markets.
Here is a graph of global savings set against their definition of global liquidity as a percentage of GDP.

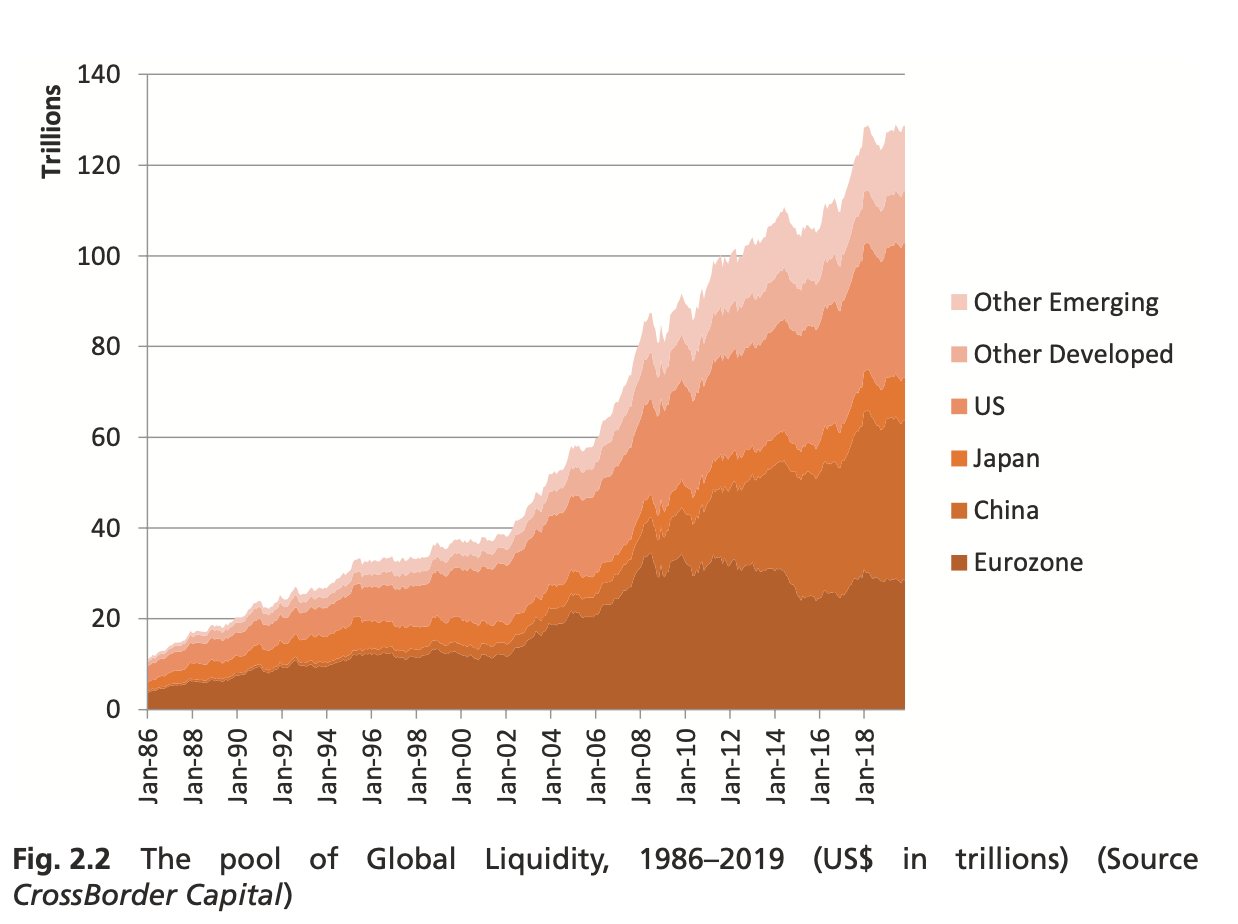
That’s a big difference. Global savings barely moves when you look at it from the vantage point of the real money circulating in the world. In 2019, CrossBorder Capital measured $130 trillion dollars of global liquidity (in 2025 its now $175 trillion). It grew 240% between 2000 and 20-2019. That’s 2/3rd bigger than world GDP. The nearest estimate to that figure is offered by the Bank of International Settlements whose figure barely reaches 32.5 trillion. A major difference is the BIS excludes domestic bank credit making when those loans are made in the local currency ($68 trillion) and instead focus in on when domestic banks make loans in foreign currency ($5 trillion).
Since 2000, global liquidity has risen 240%, led by a huge 1366% jump in Chinese liquidity and other emerging markets (which grew 374%). What that means is that there is that much more money circulating in society. The real economy (e.g. hiring workers to produce more stuff that gets sold on the market) did not expand enough to explain that money growth. It’s literally just more credit that can be accessed that drives financial markets, asset prices like stocks and real estate (and Bitcoin), and keeps down interest rates.
So what do they count?
For Howell, global liquidity isn’t just some pool of money sitting in a bank. It is that too. But its also all the credit that entities COULD get access too. It is the balance sheet capacity (how big it can get) of all credit providers. This is important because one’s capacity to borrow shapes how much risk you are willing to take on and how much refinancing you can count on.
Central bank money creation.
Retail/commercial/high street private bank money creation
Non-bank Financial Institution money creation; “shadow banking” (e.g. Corporate and Institutional Cash Pools, Eurodollar markets)
Central Bank money creation (cash in circulation, bank reserves, reverse repos, treasury bills) increased six-fold between 2000-2019. Of the $20 trillion figure in 2019 (now $50 trillion), $14 trillion of it came from the new “open market” operations of central banks (QE) after the Great Financial Crisis. Central banks main activity isn’t just controlling the price of corporate loans through the interest rate anymore, they can now directly buy the bonds (debt) of governments and corporations. It is all pretty complicated stuff (you can read the details in Chapter 7 of Capital Wars) done through “repos” instead of “loans” (more on that later), but the Central Banks simply write this down on their balance sheet as new assets. The money the central bank uses to do that is created. You can look this up with “large-scale asset purchases” or “quantitative easing.” The enormous expansion of the U.S. Federal Reserve balance sheet after the GFC was big, but it wasn’t as big in comparison to the Swiss National Bank (3002%), Bank of England (1460%), and People’ Bank of China (932%) increases. The graph below does not capture the even more incredible rise in money creation from Central Banks during the Covid-19 crisis.

There are really four central banks that matter: U.S. Fed, People’s Bank of China, European Central Bank, and the Bank of Japan. When they move the markets move. That will become important in part 3 when we apply this to history.
Retail Bank money creation. Traditionally, when observers think about retail bank money (this is your commercial bank, think Wells Fargo or any bank with a banking license) they think about the money deposited into retail banks and the credit that those banks make available based on those deposits. So, assuming 20% required for collateral, if you deposit $1,000 dollars into a checking account at Chase Bank they can go and lend out $800 of it to someone else while still claiming to hold your $1000. When the person who borrowed that $800 spends it, the person who receives it can deposit it into another bank and the process can be repeated again. That money creation is what economist call the money multiplier (or “fractional reserve banking”). Economists like to think of the money multiplier as a constant, unproblematic force in society because the amount of times it can be repeated eventually reaches zero (banks have to shave off some amount of it each time to hold in reserve).
But that perspective ignores that this kind of money creation exploded after some technical changes in the 1970s. Banks lobbied and got the reserve requirements to drop from 20% to 10% (in some cases in the West down to 1%), but more importantly electronic forms of payment changed the game: instead of loaning out just $800 based on $1000, electronic payment systems allowed retail banks to instantly use the entire $1000 as collateral for $5000 worth of credit to someone else. That $5000 instantly is now sitting in someone else checking account and can be used to create even more credit. You can read more this in Bjerg’s excellent Making Money (chapter 5). But that means, due to technical changes, there was WAY more money simply circulating in society driving asset and real estate prices and pushing economic activity. What standard accounts miss is that we aren’t likely to get another boost from a duplicative technical change in the money multiplier again. It was a historical one-time jumpstart to Western economies.
Traditional banks, in 2019 (its more now), are highly leveraged at around 10 times their equity.
Non-bank Financial Institutions (i.e. “Shadow banks,” Eurodollar markets, CICPs)
Howell’s understanding of global liquidity goes WAY beyond central and retail banks. World shadow banking, most importantly corporate and institutional cash pools (CICPs) and other non-bank financial institutions are responsible for 75% of refinancing in the world, and 15% of new credit provision. They transform regular bank assets and liabilities (retail bank’s deposits (collateral) and loans based on those deposits discussed above) into extremely long and complex “intermediation chains.” These are made up of un-invested corporate treasury funds, liquid assets holdings of forex reserve managers, cash holdings of institutional money mangers, and the cash from derivative markets.
Credit creation is not done through traditional lending (which is subject to bankruptcy rules) but through “repos” and asset-backed commercial paper. This means, for instance, that a corporate cash pool will sell some asset (getting cash for it) to another entity (say another non-bank financial institutions) and agree to repurchase the asset back at a future date. Money is created in that transaction because the cash created by the non-bank financial institution is highly leveraged. Retail banks, broker dealers, insurance companies, pension funds, hedge funds, mutual funds, major corporations, government agencies, and even central banks all do this and they do it with each other. This chain gets even bigger when repos are turned into rehypothecation agreements, which just further magnifies the money creation. The length of the collateral chains are huge, collateral just gets repledged for more and more credit.
A special case of this market is the “Eurodollar” market. It’s special because its an important way the prestige of the U.S. dollar is translated into the asset markets of countries all over the world. Basically investors and lenders borrow in one currency and invest in US dollars or borrow in US dollars and invest in a higher returning emerging market bond. This requires foreign banks (or parts of domestic banks that are technically off-shore) to store and trade in U.S. dollars. These are held in the major financial cities (including New York, but technically off-shore). This means these off-shore non-bank financial institutions are creating U.S. dollars. Even the U.S. Federal Reserve uses these markets to increase their balance sheet capacity (i.e. money create). The Fed allows these markets to use zero collateral in some parts of this and that really blurs the line between the central bank and the credit creation going on in the Eurodollar market.
Below is the conceptual mockup of the non-bank money markets and, as you can see, all players are tied into it.

If you take Howell’s measure seriously than it has deep implications for how you think macroeconomics works. Here are the implications (with anchor links to jump to each topic):
Gross capital flows matter a lot more than net capital flows because the quality of liquidity’s source effects domestic economies.
The modern world economy is defined by refinancing old debt, not financing for capital improvement.
The polarity between traditional borrowers and lenders has reversed.
The current account balance (savings vs investment) is not balanced by the interest rate. This is another way of saying Howell has an opinion on the relationship between the “financial economy” and the “real economy.”
Global Liquidity shapes the exchange rate (independent of domestic productivity changes), which effects trade deficits and asset prices.
What causes global liquidity to go up or down? It is the supply of “safe assets” and what I call “psuedo-safe” assets from the West.
Gross Capital Flows Matter More than Net Capital flows.
By definition every debt counts as a credit somewhere else in the economy. So assets (e.g. loans a bank makes to a company because the company pays the bank interest) and liabilities (e.g. that loan amount for the company that took that loan out) must match and balance sheets in the world must balance to zero. The net figure will always be the same in the world.
But this misses all the important stuff for the Salomon diaspora: it never acknowledges the character of these inflows and outflows and how big the gross numbers are.

Its okay if gross vs net is not an intuitive distinction for you. It wasn’t for me. The illustration above is an attempt to make it more intuitive. On the left side, you can imagine the bar represents the flow of capital into America. Let’s put that figure at $900 Billion. The middle figure would be the amount of capital that left the country in that same year, let’s say $800 billion. Those two figures represent the gross flows, one income and one outgoing. And you can see their source too: whether its from trade, private bank lending, buying a company, land or capital (FDI), or purchasing a stock in another country (portfolio).
The net flow is that figure on the far right. That is what most institutions pay attention to. It just the $100 billion dollar difference between those two gross numbers; that is, the $100 billion of total money that came into the U.S. Looking at the gross numbers shows substantial action and movement in markets, the net number makes it seem as if little change occurred.
Simply netting out capital flows — as implicitly happens when discussing trade and current account imbalances — loses REALLY important information. Just to tease a part 3 a bit here, Howell typically sees risk seeking, entrepreneurial capital leaving the West and risk averse capital in search of safety returning to purchase Western assets. This impacts interest rates and exchange rates.
Refinancing Defines the World Economy.
For Howell, what defines the contemporary world economy is the constant need to refinance outstanding debt. It is not the need to fund new capital investment (e.g. researching new production processes, hiring better talent, or other other investments that would lead a firm to want to expand output). This has serious implications for the importance of the interest rate (more below).
Reversed Polarity Between Lenders and Borrowers
Traditionally, retail banks intermediate funds; usually taking the deposits of households and using that as collateral to lend out to corporations who need capital for their ventures. But things have reversed polarity. Big former lenders (traditional retail banks) now get financing from previous borrowers (corporations via CICPs). What caused this is that after the 1998 Asian Crisis, emerging markets needed to accumulate huge forex reserve balances to insure against exchange rate disruptions and as a result CICPS just outgrew banking systems; their large cash deposits exceed the threshold for government retail depots guarantees.
The Current Account is Not Balanced by Interest Rates
It is the “current account balance” that in many ways represents the “real economy” in standard economics. It measures the borrowing needs of a nation. Companies either save their retained earnings in a bank account because opportunities for returns on investment are low or they spend it on capital improvements because they expect that by doing so will bring a profit. That matters for regular people because when a company makes a capital improvement (e.g. investing in land, equipment, new technology, research for a better product) that means they are trying to make a product that will sell for a higher price on the market. And when a product will sell for a higher price that company will want to expand output of that product, which will take hiring workers and raising wages to attract those workers. Which are justified costs to the company because the thing being made has a higher rate of return (because its price is higher). Hence, capital investment means a more productive economy for everyone. So the thinking goes.
Typically, the interest rate (the price/cost of new financing) is thought to balance how much companies “save” vs how much they invest in new capital. This is what the “global savings glut” is worried about, that companies retain too much of their earnings rather than spend it on capital improvement. If the interest rate goes up than that would cause companies to start saving more money rather than to take out loans (because the cost of that financing has gone up). If the interest rate is lower than that will incentivize companies to take out loans and spend it on capital improvements. That’s what the news means when they talk about interest rates “cooling” the economy or “running hot.” Traditionally, economics teaches that short-term interest rates are set by smart people in central banks trying to balance savings and investment. Those same people are also thought to try and influence long term interest rates through “forward guidance” (i.e. language games), Large Scale Asset Purchases (buying government and corporate debt), and quantitative easing (QE). Event studies (e.g. Gagnon 2016) — which Howell and friends believes are flawed — purport to support that QE causes interest rates to fall.
“From our market experience almost every dimension of this conventional paradigm seems wrong,” writes Howell in Capital Wars (p59).
Yup, they want no part of that conventional wisdom. Their issue with it stems from their fundamental belief that in a world defined by refinancing needs (not financing for new capital), higher interest rates are but a nuisance to investors; investors ALWAYS need to borrow more to roll over debt no matter the price. What investors really care about is the exchange rate. While the price of capital matters somewhat (interest rate), it is the exchange rate that matters more because that is the purchasing power of the capital borrowed. And what determines the exchange rate are gross flows of capital.
Thus, Howell and CrossBorder Capital believe believe international gross capital flows drive national “current accounts” (savings vs investment) rather than passively accommodating them.
They offer the chart below which shows precisely the opposite logic from traditional economics: 10-year U.S. Treasury term premia (the compensation investors require to take on risk) rise (not fall) by an average of 135 bp with the Fed’s QE periods.

The error they see in standard accounts is that they do not consider the way that demand for “safe assets” (e.g. treasury securities, German bunds, the corporate bonds of long-term cyclical Western companies) changes as central banks signal their actions. If, alongside a QE expansion in the U.S., global liquidity increases (making refinancing easier) then demand for safe assets will drop because investors are willing to pursue riskier assets. This would mean a rise in long-term rates in order to attract scarcer demand to purchasing those safe assets. And since long-term rates are what matter when thinking about long-term capital investment projects this is what has an impact on the real economy. This is why macroeconomist seem confused that short and long term rates diverge. You can see this in Howell’s correlation between their measure of US liquidity and the 10-year US treasury yield spread.

He quite literally believes that short term interest rates (supposedly set by human central bankers) follow long-term rates and those long-term rates (determined by the behavior of bonds traders) are responding to international gross capital flows. Sure, lower interest rates incentivize some capital borrowing and spending, but how much you can buy with that money is determined by the exchange rate. For CrossBorder Capital it is the exchange rate that supersedes the interest rate mechanism.
Liquidity Shapes Exchange Rates, Trade Deficits, Asset Prices
Traditionally, exchange rates are thought to restore balance to trade deficits. That means if a country has more imports than exports (like the U.S.), it’s productivity has fallen, which will push down the value of its currency. A lower currency will then lead to cheaper exports. This should, in theory, cause its exports to increase after a time because its goods got cheaper from the falling currency; thus, its exports will go up and balance to the original trade deficit would be restored.
(This is what J.D. Vance thinks when he says he wants to artificially devalue the dollar. And this is the logic that drives tariffs on U.S. imports. It’s an effort to use protectionism to get U.S. exports a leg up in global markets. Remember, part 1 when Obestfield said that U.S. exports never went down; the people who run those firms are political players who benefit from tariffs. Not retaliatory tariffs though, which is important politically).
Once again, Howell and CrossBorder Capital thinks the opposite happens. In their experience, when a country has a rising currency from increasing domestic productivity, rather than dampen its economic activity (i.e. from more expensive exports) they observe that it coincides with more international capital flowing into the country in order to chase high-returns from growing productivity. Because those capital inflows are from private market credit creation (remember the quality of the money matters) this is considered good liquidity and therefore will have a positive effect on the exchange rate. Gourinchas et al. (2019) — at Berkeley :) — show this valuation adjustment nicely. For CrossBorder Capital rising exchange rates usually mean strong inflows of capital, which causes more economic activity, which then leads to more exports.
What usually also happens in these moments though is that emerging markets want to keep their value of their currency low (because they want to keep doing the export game) so they simultaneously will inject domestic central bank created cash. Because the source of those funds (central bank money) is consider poor liquidity this will slow the appreciation of the currency. China was forced by the U.S. to let its currency appreciate around 2006, which led to rising labor costs (I will post about that another time). Because of this countervailing domestic forces, this, in turn, forces the adjustment onto local asset prices.
This is why there has been asset booms in real estate all over the “emerging market” world.
In summary, liquidity shocks can come externally through net capital inflows or internally from faster productivity growth on domestic profits, they both trigger real exchange rates to appreciate. A surge in gross capital inflows (e.g. speculative portfolio flows and bank financing flows) is going to increase the exchange rate of a country (unless there is an accompanying expansion in the domestic central bank money creation). While productivity growth in an economy will also cause currency appreciation. This is why the U.S. (with its long-term productivity slowdown) has had a long term decline in its exchange rate (there are important temporary reversals which we will get to in part 3).
The Global Importance of the U.S. Exchange Rate and its “Safe Assets”
What determines whether global liquidity goes up or down? Global liquidity is very sensitive to the U.S. exchange rate. A stronger dollar makes it more expensive for banks and non-banks to access dollar denominated assets. Those assets are really important because they are the things that foreign banks use as collateral to create more credit in their domestic markets. What that means is a bank in the (lets say) the Philippines uses the debt it purchases from the U.S. as collateral to do a money multiplier in its domestic credit market. A weaker dollar is associated with an increase in global liquidity. The private money creation from the wholesale money markets (the CICSP, Eurodollars) need infusions of collateral upon which to create credit to sell elsewhere. The CICPS get these collateral through repos of the safe assets owned by retail banks (remember these are just offshoots of each other at times).
So what makes dollar-denominated assets so important? The answer is that they are considered “safe assets.” The way to think about what is a “safe asset” is an investment that one expects will cover future liabilities in a predictable, timely fashion. We should add though, that in practice, they are assets that receive low “haircuts” (how much must be withheld to use as collateral) when they are rehypothecated (used as collateral for money creation chains). This requires collective belief within a community of buyers and sellers that the asset is, if one were to buy it, one that will keep paying interest (no matter the political climate, no matter the economic condition, etc), will be expected to outpace inflation, and can be turned into cash quickly.
The canonical “safe asset” is the 10-year U.S. Treasury bond. A Treasury bond is a piece of paper that the government sells that it will agree to pay you for owning it, plus interest. It is how the government takes out debt to fund its operations. So the safety of this asset is based on the belief that the U.S. government will always have the taxes and political will to pay its debts. Safe assets can also German bunds, cash deposits, and they can also be the corporate bonds of large, long-term Western “cyclical” companies. So not companies that are experiencing high-growth, but the debt of companies that grow steady with the normal business cycle (e.g. Coca-Cola or Johnson & Johnson).
Their main utility is that because they are considered a sure bet to keep paying, the non-bank financial world can use them as collateral to create more credit elsewhere. Gorton et al. (2012) one-third of total assets are “safe” and one-third of those are government securities. Here is a chart of how safe assets are pro-cyclical with global liquidity.

Cross border capital argues that when these safe assets are in short supply, the non-bank financial markets starts trying to come up with private sector emulators of “safe assets.”
In my Economy & Society course I teach at Berkeley I call these “pseudo-safe assets.” For example, American households were encouraged to extend their mortgage financing in the lead up to the Great Financial Crisis. This created a temporary boost to “safe assets”’ upon which global liquidity could expand. This came in the form of mortgages that were bundled together into mortgage backed securities (MSB). But this was really just an emulator of safe asset. It required some institutions to make it appear to be safe. What we call “market devices” in sociology. This is what happened when ratings agency’s started treating lower tier BBB grade MBS as tier 1 AAA. See Donald Mackenzie’s fantastic piece on this. You can find similar stories in the savings and loans crisis in the late 80s and during the 2001 dot.com crisis. The market device in the later were financial advisors on CNN telling the public that anything with a “.com” in its name was an A+ stock investment. Those talking heads were just employees of the banks funding IPOs. In the later GFC, these pseudo-safe assets got rehypothecated all over the world tying U.S. households’ ability to pay their mortgages to every bank from Germany to Shanghai. CrossBorder Capital surmises that what caused the Great Financial Crisis was (in addition to the asset bubble) the People’s Bank of China’s decision to contract its liquidity production. When refinancing supply came up short in China those borrowers (and there were a lot of them) sought liquidity in Europe and this created a global liquidity crunch. Neil Fligstein’s excellent “The Banks Did It” shows how every bank in the world essentially became tied into this business of generating refinancing off these pseudo-safe assets.
Three takeaway points from this last section:
Financial crisis. A reduction in the supply of Western safe assets will cause emulators in the private sector to start emerging (pseudo-safe assets). When their rehypothecation gets really profitable most financial institutions in the world get drawn in, which ties their fates together. That is only one side of the financial crisis coin. When there is suddenly a drop in liquidity provision somewhere in the world, which reduces the demand for private sector alternatives, then you have the straw that breaks the camel’s back. There will be a mad dash to the real safe assets during a liquidity downturn.
Assets (Bitcoin, real estate, equity/stocks/S&P500) grow with global liquidity. Howell produces the bitcoin regressions on his Substack. The more Western safe assets (U.S. Treasuries, western corporate bonds of cyclical firms, cash deposits) there are the more global liquidity grows. When liquidity is plentiful risk-taking is widespread because investors have more refinancing credit they can rely on (i.e. they know they can get access to more balance sheet growing credit) to seek out risky assets. This is why Bitcoin tracks with global liquidity, why real estate prices surge in Emerging markets, and why the S&P500 seems like it always goes up.
U.S.’s ability to take on debt. The global demand for Western safe assets lowers their domestic bond term premia. Gourinchas et al. (2019) show that the money outflowing from the U.S. gets a 2% higher return investing elsewhere than the foreign money coming in to buy U.S. safe assets. There is a demand for their debt to be used as collateral for money creation elsewhere in the world. This is the thing that explains the persistence of American power despite its difficulties.
And with that I turn you to part 3. Applying this broader definition of global liquidity to understanding the past four decades of history and the supposed “global savings glut.”
More reading: Rey 2015; Borio 2019; Gourinchas et. al 2019.
Quote
So, assuming 20% required for collateral, if you deposit $1,000 dollars into a checking account at Chase Bank they can go and lend out $800 of it to someone else while still claiming to hold your $1000.
Unquote
Fractional reserve banking was relaxed during COVID and not brought back
No reserve requirements now
Pump it up
A board monitors the banks assets and liabilities instead
And sometimes not to well
Great article!
Whats the best indicator or chart to use on trading view or any other website to track global liquidity most accurately according to you?